Conversion Rate in GA4
Conversion Rate in Google Analytics 4
Understanding and leveraging data is vital to online success in the ever-evolving digital marketing landscape. Google Analytics 4 (GA4) emerges as a powerful tool in this data-driven era, providing deep insights into user behavior and website performance. Among its various metrics, the conversion rate stands out as a critical measure of success. But what makes the conversion rate in GA4 so pivotal for businesses aiming to enhance their SEO visibility and traffic activities?
Conversion rate is a term often thrown around in digital marketing discussions, but its true power lies in its ability to transform raw data into actionable insights. In GA4, the conversion rate isn’t just a number; it reflects how effectively a website turns visitors into customers or leads. It’s about understanding user interactions, gauging the effectiveness of content and campaigns, and ultimately, driving business growth.
In this comprehensive guide, we’ll explore the nuances of conversion rate in the context of Google Analytics 4. We’ll start by demystifying what conversion rate is and why it’s crucial. Then, we delve into the two types of conversion rates in GA4, providing clarity on how they differ and their significance. Following this, we’ll examine the standard GA4 reports, a treasure trove of information where conversion rates reveal the story behind user interactions. Finally, we’ll guide you through building an exploration with conversion rates in GA4, a process that empowers you to dive deeper into your data, uncover hidden trends, and make data-driven decisions to optimize your online strategy.
Whether you’re a seasoned digital marketer, an SEO specialist, or a business owner looking to boost your online presence, understanding conversion rate in GA4 is a step towards mastering the art of online analytics. Let’s embark on this journey to unlock the potential of conversion rates in Google Analytics 4 and transform your SEO and marketing efforts.
1-) What is the Conversion Rate Formula?
The conversion rate is a key performance indicator in digital analytics, representing the percentage of visitors who take a desired action on a website. This action could range from making a purchase, filling out a form, subscribing to a newsletter, or any other goal that aligns with the business’s objectives. The conversion rate is calculated by dividing the number of conversions by the total number of visitors and then multiplying the result by 100 to get a percentage.
 A high conversion rate indicates that the website is successfully convincing visitors to take the desired action, which could be attributed to effective website design, compelling content, or efficient marketing strategies. Conversely, a low conversion rate might signal barriers to conversion, such as poor website navigation, unappealing call-to-action (CTA) buttons, or irrelevant content.
For SEO and digital marketing, conversion rate serves as a critical metric to measure the return on investment (ROI) of online activities. It helps evaluate which marketing channels and strategies are most effective in driving conversions and where improvements are needed. By monitoring and optimizing the conversion rate, businesses can:
- enhance user experience,
- increase customer satisfaction,
- ultimately drive growth and profitability.
2-) Two Types of CR in Google Analytics 4
In Google Analytics 4, conversion rate tracking evolves with the introduction of two types: User Conversion Rate and Session Conversion Rate. Understanding these two types is essential for businesses to measure and optimize their online performance accurately.
User Conversion Rate in GA4
User Conversion Rate focuses on the percentage of users who complete a conversion during their visit. This metric provides a user-centric view, highlighting how many unique visitors perform the desired action. It’s particularly useful for understanding the effectiveness of user engagement strategies and the overall user experience on the website.
 Session Conversion Rate
 Session Conversion Rate
On the other hand, Session Conversion Rate is calculated by dividing the number of sessions with a conversion event by the total number of sessions.
3-) Standard GA4 Reports
Google Analytics 4 offers a range of standard reports that are instrumental in analyzing conversion rates. These reports provide a comprehensive view of user behavior, traffic sources, content effectiveness, and conversion patterns.
One of the key reports in GA4 is the ‘Conversions’ report, which details the number of conversions and the conversion rate for each defined goal. This report helps businesses understand which goals are being met and at what rate, allowing for targeted optimizations.
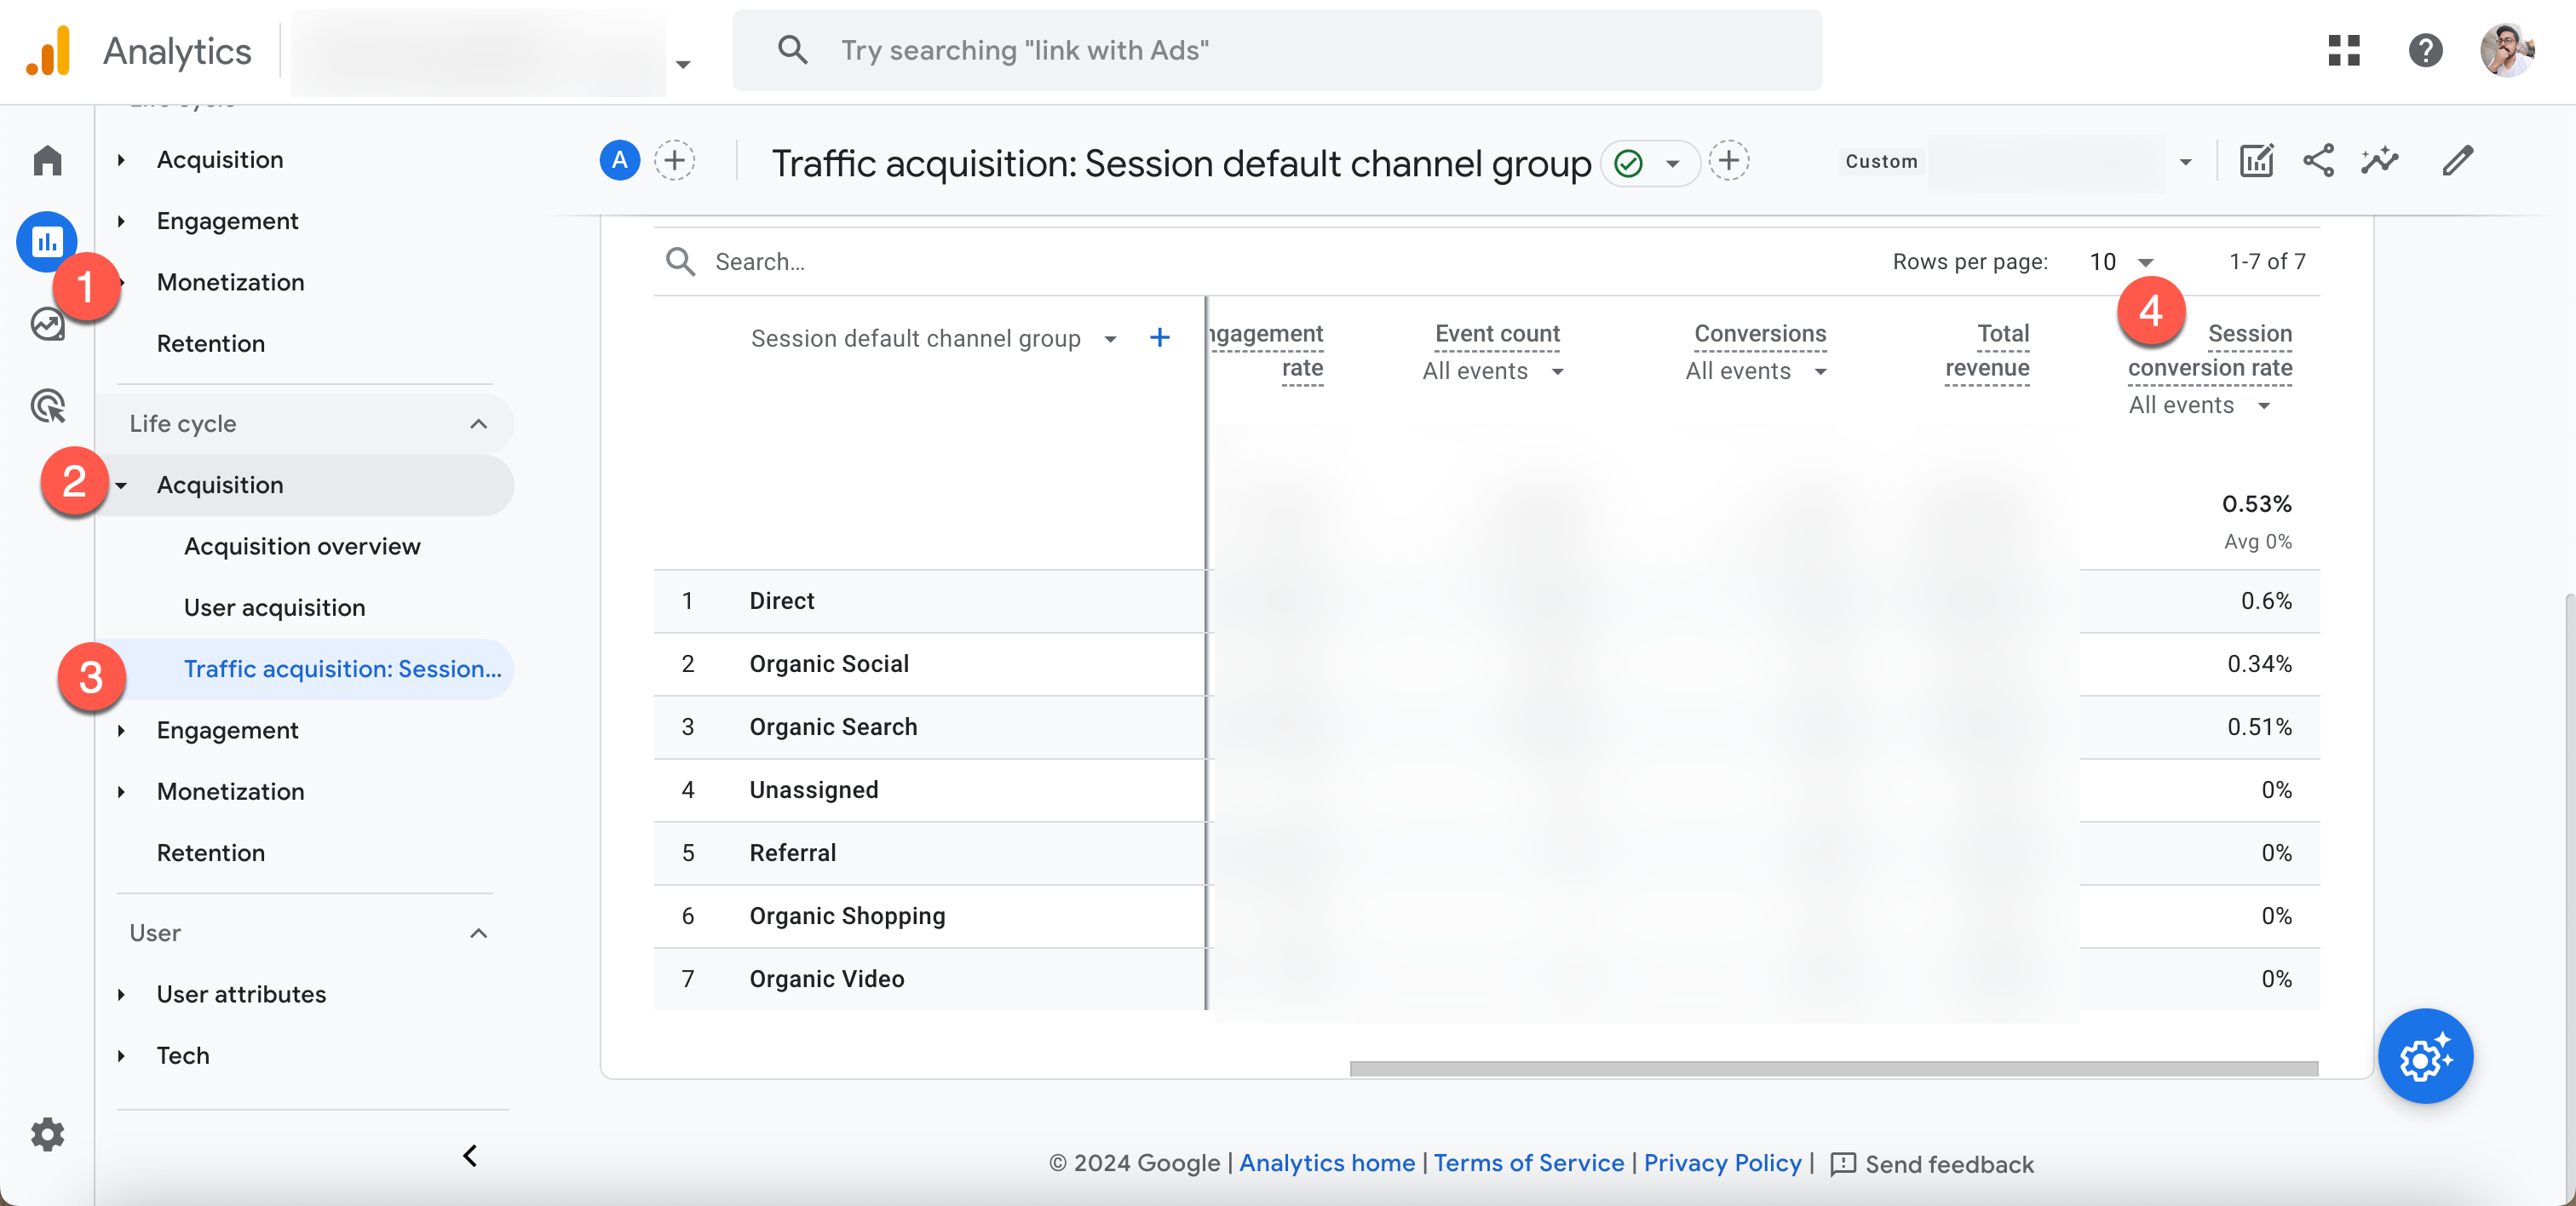 The ‘User Acquisition’ report in GA4 is another critical tool. It breaks down where your users come from and how different channels contribute to conversions. By analyzing this report, businesses can assess the effectiveness of their marketing channels and adjust strategies to maximize conversion rates from the most profitable sources.
The ‘Engagement’ report focuses on how users interact with your website. It includes metrics like average engagement time, pages per session, and event count. This report is essential for understanding which content or pages are most engaging and how they influence the conversion rate.
Additionally, the ‘Monetization’ report provides insights into the revenue generated from conversions. This includes e-commerce purchases and in-app transactions. By linking conversion rates to monetary value, businesses can better understand the financial impact of their SEO and marketing efforts.
4-) Building a Calculated Field as “Conversion Rate” in Looker Studio
Building an exploration with conversion rate in Google Analytics 4 involves creating a custom analysis to dive deeper into your conversion data. And it’s very easy to add conversion rate in GA4 Exploration Report but you’re also enabled to create a “calculated field” in Looker Studio to track your conversion rate. Here you can find conversion rate metric as a calculated field in Looker Studio:
- Click on “Add Metric” button under “Metrics” in the right sidebar,
- Select “Add Field”
- Then you should add name like “Conversion Rate – Calculated Field”
- In the formula area, you should add “Conversions / Sessions”
- Also select “Percent” in “Data Type”
- So, you have a custom field calculating conversion rate in Looker Studio